Dynamics 365 Power Bi and Reporting – How To Guide
Dynamics 365 simplifies reporting, streamlines month-end close and reduces data entry errors. This means you can make better and more informed decisions.
Getting insights into your Business Central data is easy with Power BI. Power BI natively retrieves Business Central data allowing you to build dashboards and reports based on your company’s data.
Power BI provides a flexible alternative to reports built in Business Central. It enables you to drill down and customise the visualisation, and even merge data from different companies.
Why our Customers love this feature
For finance teams, having the ability to access timely accurate reports is essential for the running of their business. Microsoft’s cloud reporting tool, Power BI, takes the existing reporting capabilities of Business Central to a new level. Cloud based reporting available on your PC, Tablet and Phone.
Typical uses of this function include;
- Transform your data into insights through visualisations, dashboards and self-service reports.
- View Power BI reports in Business Central, thereby avoiding skipping back and forth between the two applications to view data and analysis.
- Create reports and dashboards in Power BI that display Business Central data in real time.
- Export data to Word, Excel, or PowerPoint to build presentations and reports, and encourage collaboration.
This simplified reporting is one of our Top 5 Features of Dynamics 365 Business Central.
Power BI and Business Central
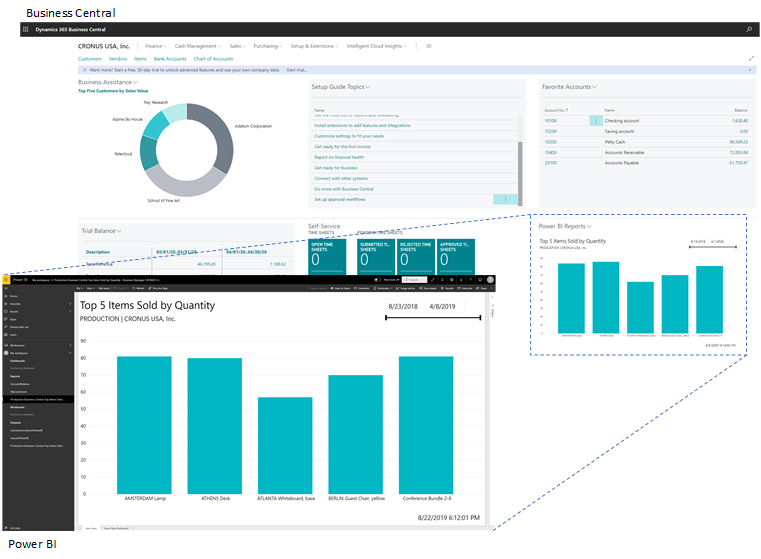
Embedded Reports in Business Central as Standard
Some Power BI reports can be embedded in Business Central and viewed without leaving the system. More complex dashboards are better experienced from the Power BI web site.
Custom Power BI Reports
PowerBI is a fully featured reporting engine that allows you to create your own customised reports.
To write reports, you need a Power BI license, and then download the PowerBI desktop.
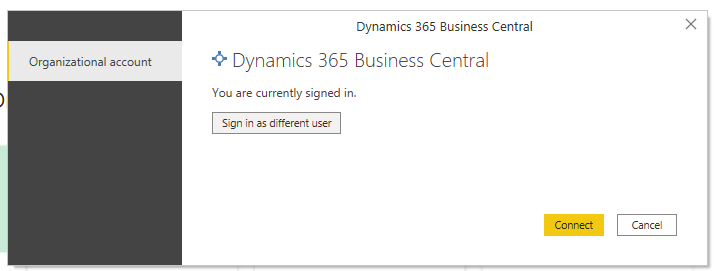
Once downloaded, it is simple to connect to your company data. Microsoft provide a connector in Power BI:
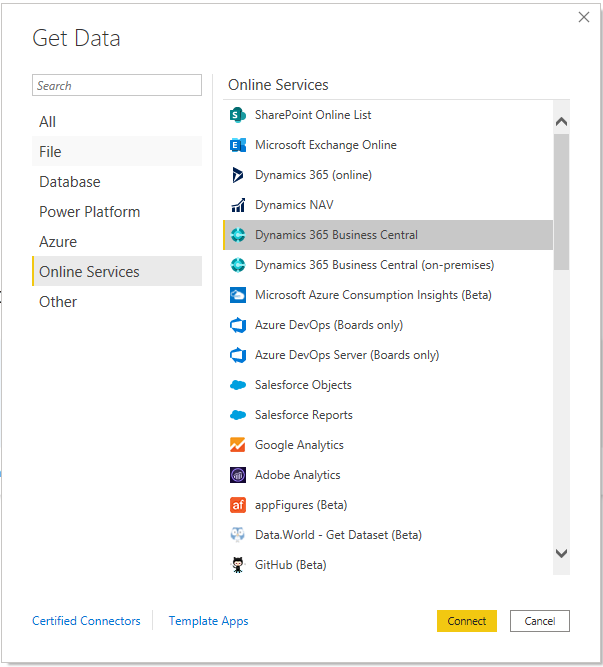
This provides, quick and secure access to your data:
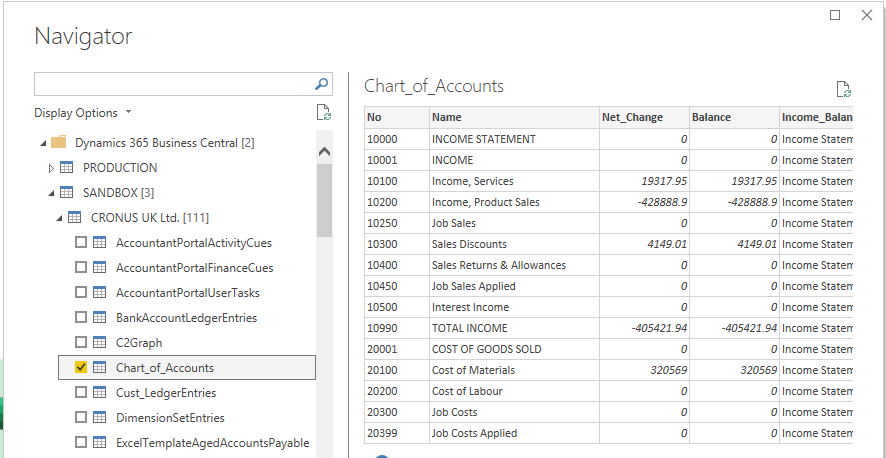
Once signed in, you can choose the company, and data you wish to retrieve:
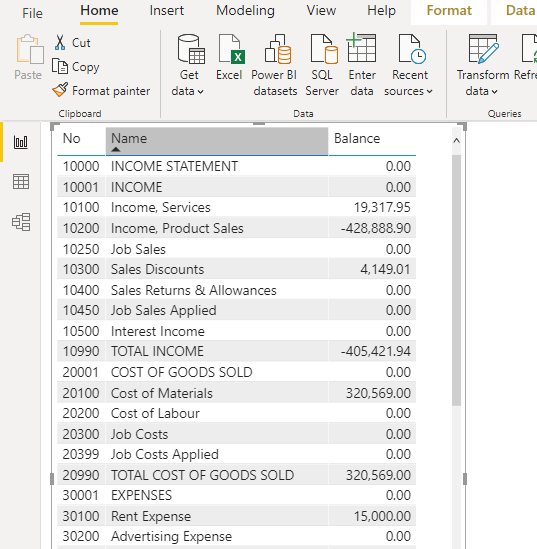
Using Power BI Visualisations, you can drag and drop the data to create reports, that can be published to the power BI Portal, then distributed and shared with your users:
Power BI Apps and Templates
Microsoft have made available a series of report templates to get you started, bundled together in PowerBI Apps. These can provide a quick starting point, for your reporting needs:

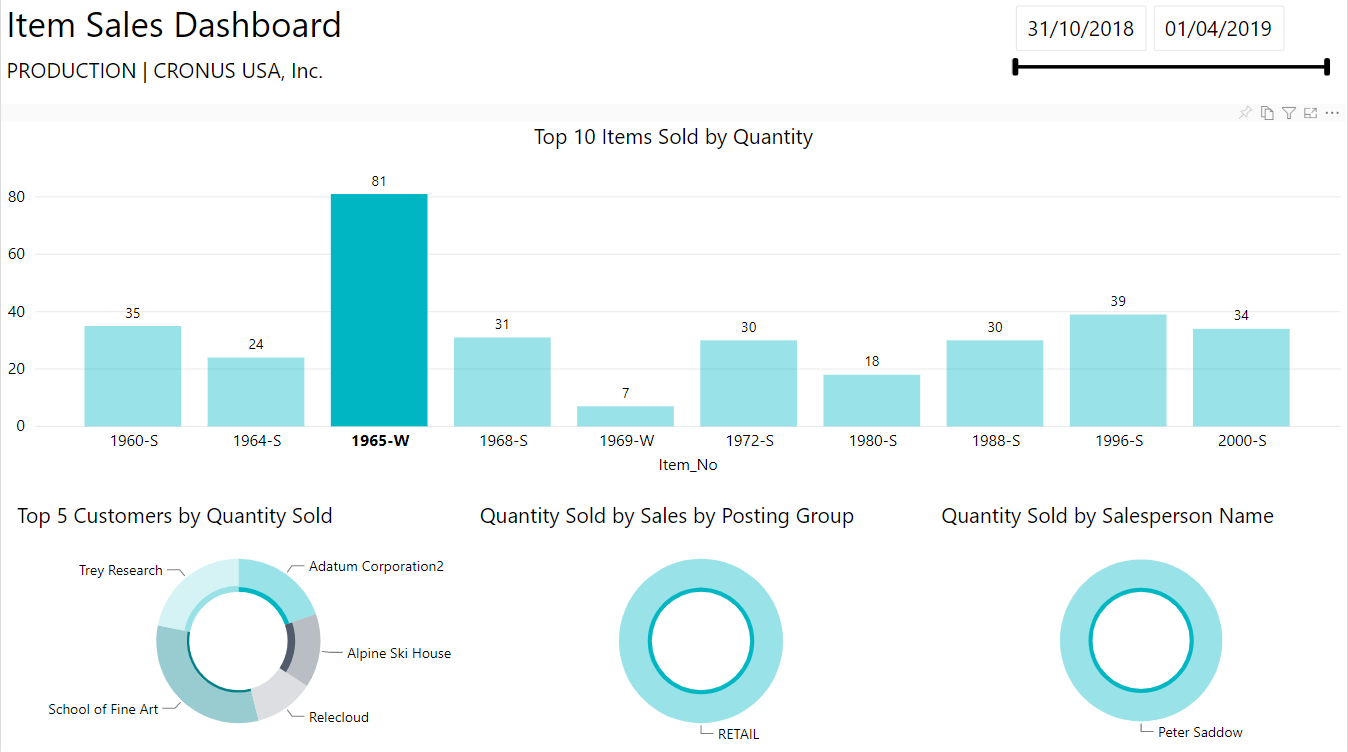
Each app provides reports that you can drill into. Currently there are two Business Central Apps for finance and sales. The example below provides an introduction to a sales dashboard report.
Included in this sample app, for example, is a sales analysis report:
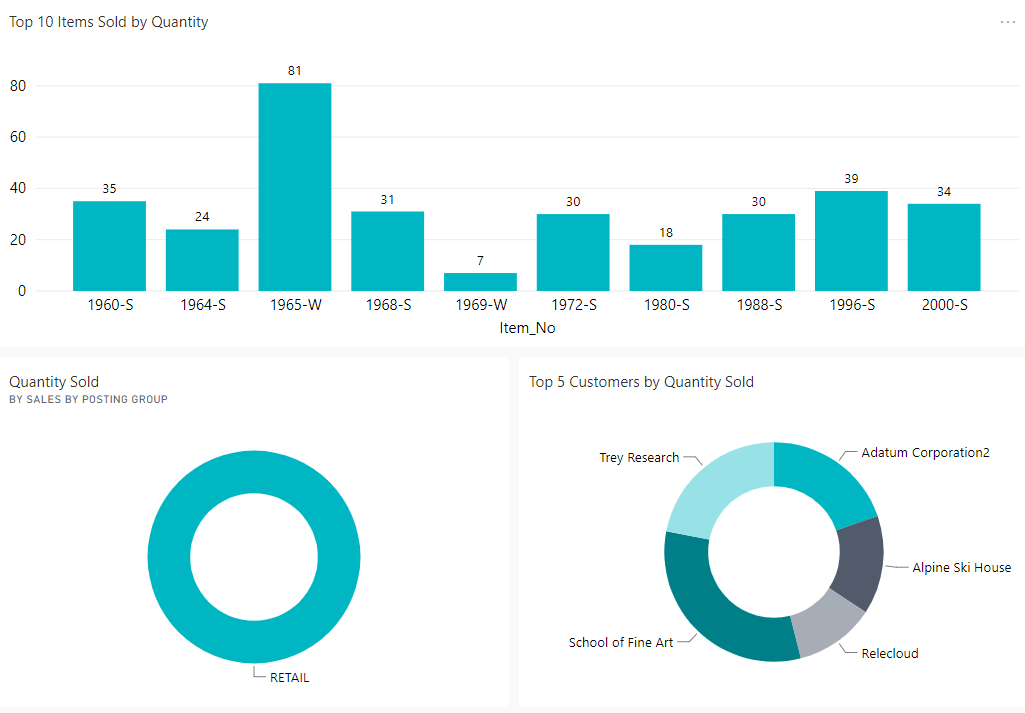
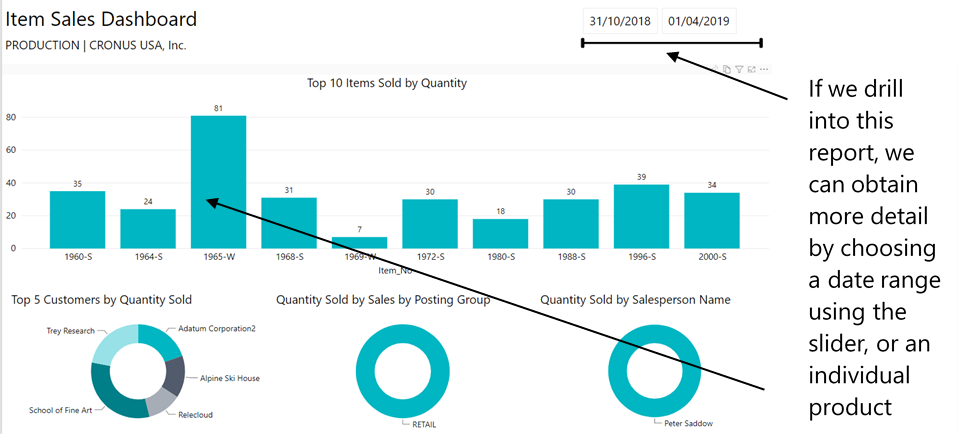
Selecting a single product then updates the pie charts below, showing who you sold the item to, which type of customer and the sales person responsible:
Summary
Business Central connects directly with Power BI to create custom reports and dashboards. Displaying this data in a visual format means your employees can interpret it more easily and make better, informed decisions. Through the rich visuals and custom dashboards, you gain insights you wouldn’t otherwise get from standard reports. This allows you to improve processes and spot trends faster, so you can outperform competitors and better service customers.
Moreover, Power BI pulls data from all your systems, not just Business Central, giving you a complete picture of your business in real time. This information can also be exported to Word, Excel, or PowerPoint, at any time, to build presentations and reports.
For more information, visit our Dynamics 365 Business Central page or simply get in touch.

